


Most real estate agents consider themselves “people” people and aren’t as comfortable with data, graphing, pulling numbers, etc. However, if you could master finding out how to pull just six pieces of data in your MLS, I guarantee you will be more confident in your buyer and seller consultations, will be able to drop numbers and trends in conversations, and will have plenty of content for sending out to your clients and posting on social media.
If you spent a total of one hour per month on pulling these numbers and creating corresponding graphics, I guarantee you will see a monumental change in your business.
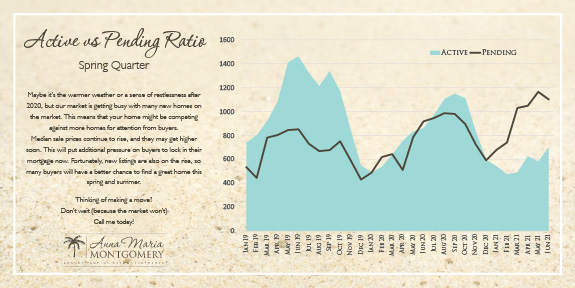
Active and Pending Ratios
Showing what is happening with your active inventory and properties that have gone under contract essentially showcases supply and demand at work in your market. Just how high is demand for the amount of available inventory?
Median Sales Price Change over varying time periods
Today’s median sales prices may be impressive, but how do they compare with one year ago, five years ago, or even ten or twenty years ago? This is a great tool for providing much-needed perspective regarding just how much prices have appreciated and that yes, they can still go up.

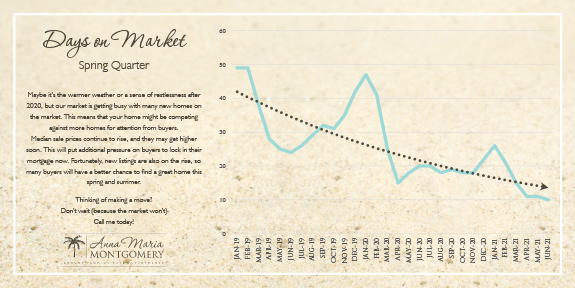
Days on Market
How long a property takes to sell is a great indicator of how buyer- or seller-friendly a market is. When you show just how much the market has changed with days on market on a graph, it really brings the situation to life.
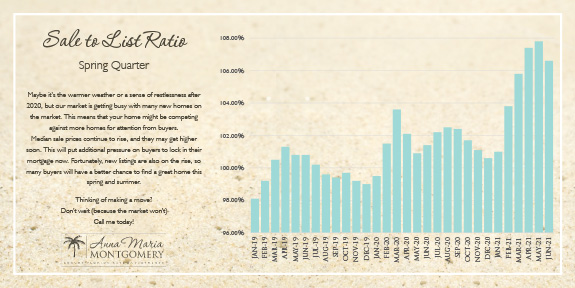
Sales Price to List Price Ratio
Sellers hope to at least get list price for their property, but in high demand markets, multiple offers can drive this up over 100%. Therefore, I use this number to determine the presence of multiple offers and to track demand.
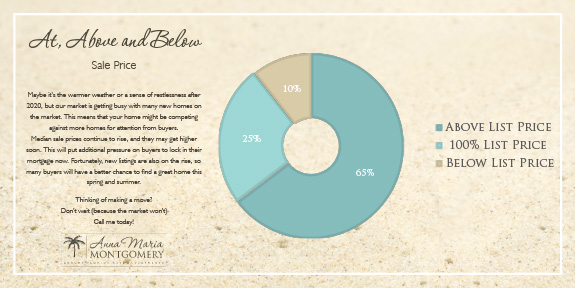
Final Sales Price Above List Price
Similar to sales price to list price ratio in that it indicates multiple offers, by indicating just how much above list price houses are selling for – in dollars – can make a percentage feel very real and attainable for potential sellers.
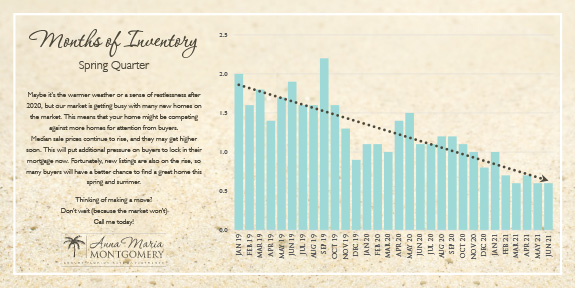
Months of Inventory
It is said that a balanced market has between four-six months of supply of inventory. Just how much inventory does your market have?
Notice on the graphs that I included a trend line or important elements to look at? As agents, we see these graphs all the time, but when I include an element of education, this draws the reader in so they understand what they are looking at and will hopefully read your message and call to action.
Did you know that by really focusing on how the market is performing with actual numbers, this provides proof for what buyers and sellers may have heard about the market, compelling them to contact you to take action?
I have been working with about 20 agents over the last two years to incorporate really meaty data like this into their mailers to their farm and niche markets and many of them are starting to see some really incredible results –six figure commission results.
Don’t underestimate the power of data! Contact your local MLS and learn how to pull just one or two of these numbers and get empowered by the numbers!
Want to learn more about creating mailers that make sellers want to take action? This is the LAST CALL for my Search for Sellers and Find Success class on July 21 in Lynnwood, WA. We only have a few spots left and registration closes tomorrow!

Interested in learning more about open houses and presentations? Need more sellers in your pipeline? Want to learn how to manage conflict, speak your truth, and make more money?
We are very excited to announce our summer and fall class lineup! Most classes are LIVE and in-person.
 |
 |
 |
 |
 |
 |

By Denise Lones CSP, M.I.R.M., CDEI – The founding partner of The Lones Group, Denise Lones, brings nearly three decades of experience in the real estate industry. With agent/broker coaching, expertise in branding, lead generation, strategic marketing, business analysis, new home project planning, product development, Denise is nationally recognized as the source for all things real estate. With a passion for improvement, Denise has helped thousands of real estate agents, brokers, and managers build their business to unprecedented levels of success, while helping them maintain balance and quality of life.
 Posted in
  Tags:
Tags: 

which if any classes will be on line? Im interested in finding sellers but my office is in Gig Harbor
Cheryl – Currently, only the 50 Hottest Trends in New Construction and Renovation is being offered in online format on August 11th. That is going to be a fantastic class and you should check it out at that link to learn more. It is also a one-time-only class.
If you wanted to take the ferry for the Search for Sellers class, today’s the last day to register for that July 21st class. – Denise
Do you have a graphic artist that can put “6 Pieces of Data to Wow Your Clients (and tell your market’s story)”
together if provided the information?
Cheryl – Yes. Actually there are a few different options here. You could just work order the graphs, but you might also be interested in our Auto Follow-Up program. Give my office a call 360-527-8904 / solutions@thelonesgroup.com to discuss which option will work best for you. – Denise